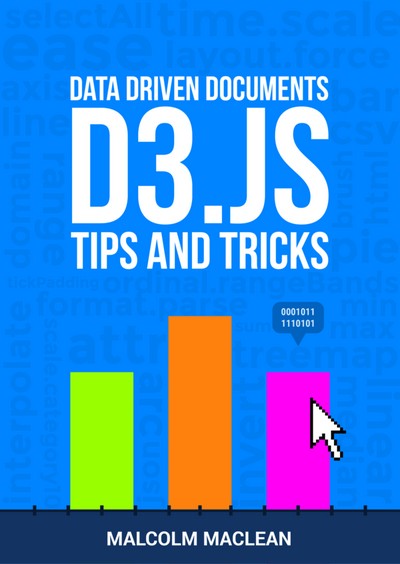
D3 Tips and Tricks v3.x: Interactive Data Visualization in a Web Browser
Over 600 pages of tips and tricks for using d3.js, one of the leading data visualization tools for the web. It's aimed at getting you started and moving you forward. Includes over 50 downloadable code examples.
Publication date: 15 Aug 2016
ISBN-10: n/a
ISBN-13: n/a
Paperback: 620 pages
Views: 13,208
D3 Tips and Tricks v3.x: Interactive Data Visualization in a Web Browser
 Over 600 pages of tips and tricks for using d3.js, one of the leading data visualization tools for the web. It's aimed at getting you started and moving you forward. Includes over 50 downloadable code examples.
Tag(s):
Data Science
JavaScript
Web Design and Development
Publication date: 15 Aug 2016
ISBN-10: n/a
ISBN-13: n/a
Paperback: 620 pages
Views: 13,208
Document Type: Book
Publisher: Lulu.com
License: n/a
Post time: 11 Dec 2016 02:00:00
Publication date: 15 Aug 2016
ISBN-10: n/a
ISBN-13: n/a
Paperback: 620 pages
Views: 13,208
Document Type: Book
Publisher: Lulu.com
License: n/a
Post time: 11 Dec 2016 02:00:00
Excerpts from the About Page:
D3.js can help you make data beautiful.
D3 Tips and Tricks is a book written to help those who may be unfamiliar with JavaScript or web page creation get started turning information into visualization.
Data is the new medium of choice for telling a story or presenting compelling information on the Internet and d3.js is an extraordinary framework for presentation of data on a web page.
What version of d3.js is this written for?
Version 3.x If you're looking for the latest edition of this book that was written for version 4.x you can find it here...
Is this book for you?
It's not written for experts. It's put together as a guide to get you started if you're unsure what d3.js can do. It reads more like a story as it leads the reader through the basics of line graphs and on to discover animation, tooltips, tables, interfacing with MySQL databases via PHP, sankey diagrams, force diagrams, maps and more...
Tweet
About The Author(s)
No information is available for this author.
Book Categories
Computer Science
Introduction to Computer Science
Introduction to Computer Programming
Algorithms and Data Structures
Artificial Intelligence
Computer Vision
Machine Learning
Neural Networks
Game Development and Multimedia
Data Communication and Networks
Coding Theory
Computer Security
Information Security
Cryptography
Information Theory
Computer Organization and Architecture
Operating Systems
Image Processing
Parallel Computing
Concurrent Programming
Relational Database
Document-oriented Database
Data Mining
Big Data
Data Science
Digital Libraries
Compiler Design and Construction
Functional Programming
Logic Programming
Object Oriented Programming
Formal Methods
Software Engineering
Agile Software Development
Information Systems
Geographic Information System (GIS)
Mathematics
Mathematics
Algebra
Abstract Algebra
Linear Algebra
Number Theory
Numerical Methods
Precalculus
Calculus
Differential Equations
Category Theory
Proofs
Discrete Mathematics
Theory of Computation
Graph Theory
Real Analysis
Complex Analysis
Probability
Statistics
Game Theory
Queueing Theory
Operations Research
Computer Aided Mathematics
Supporting Fields
Web Design and Development
Mobile App Design and Development
System Administration
Cloud Computing
Electric Circuits
Embedded System
Signal Processing
Integration and Automation
Network Science
Project Management
Operating System
Programming/Scripting
Ada
Assembly
C / C++
Common Lisp
Forth
Java
JavaScript
Lua
Rexx
Microsoft .NET
Perl
PHP
R
Python
Rebol
Ruby
Scheme
Tcl/Tk
Miscellaneous
Sponsors